Dashboard
Ops Analytics
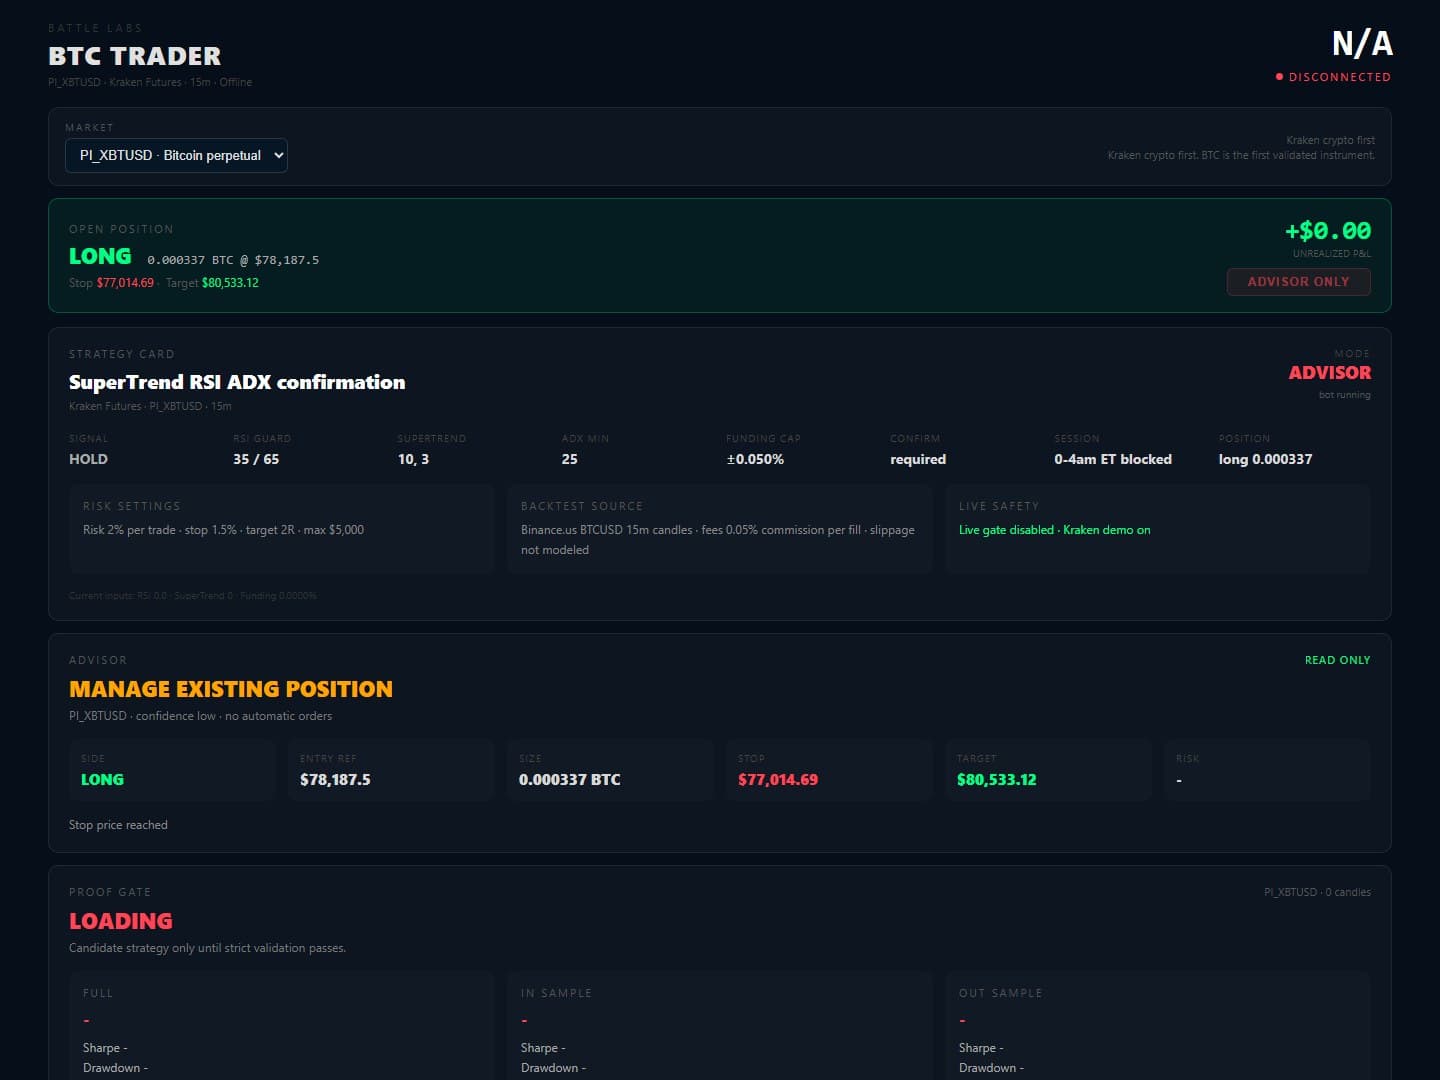
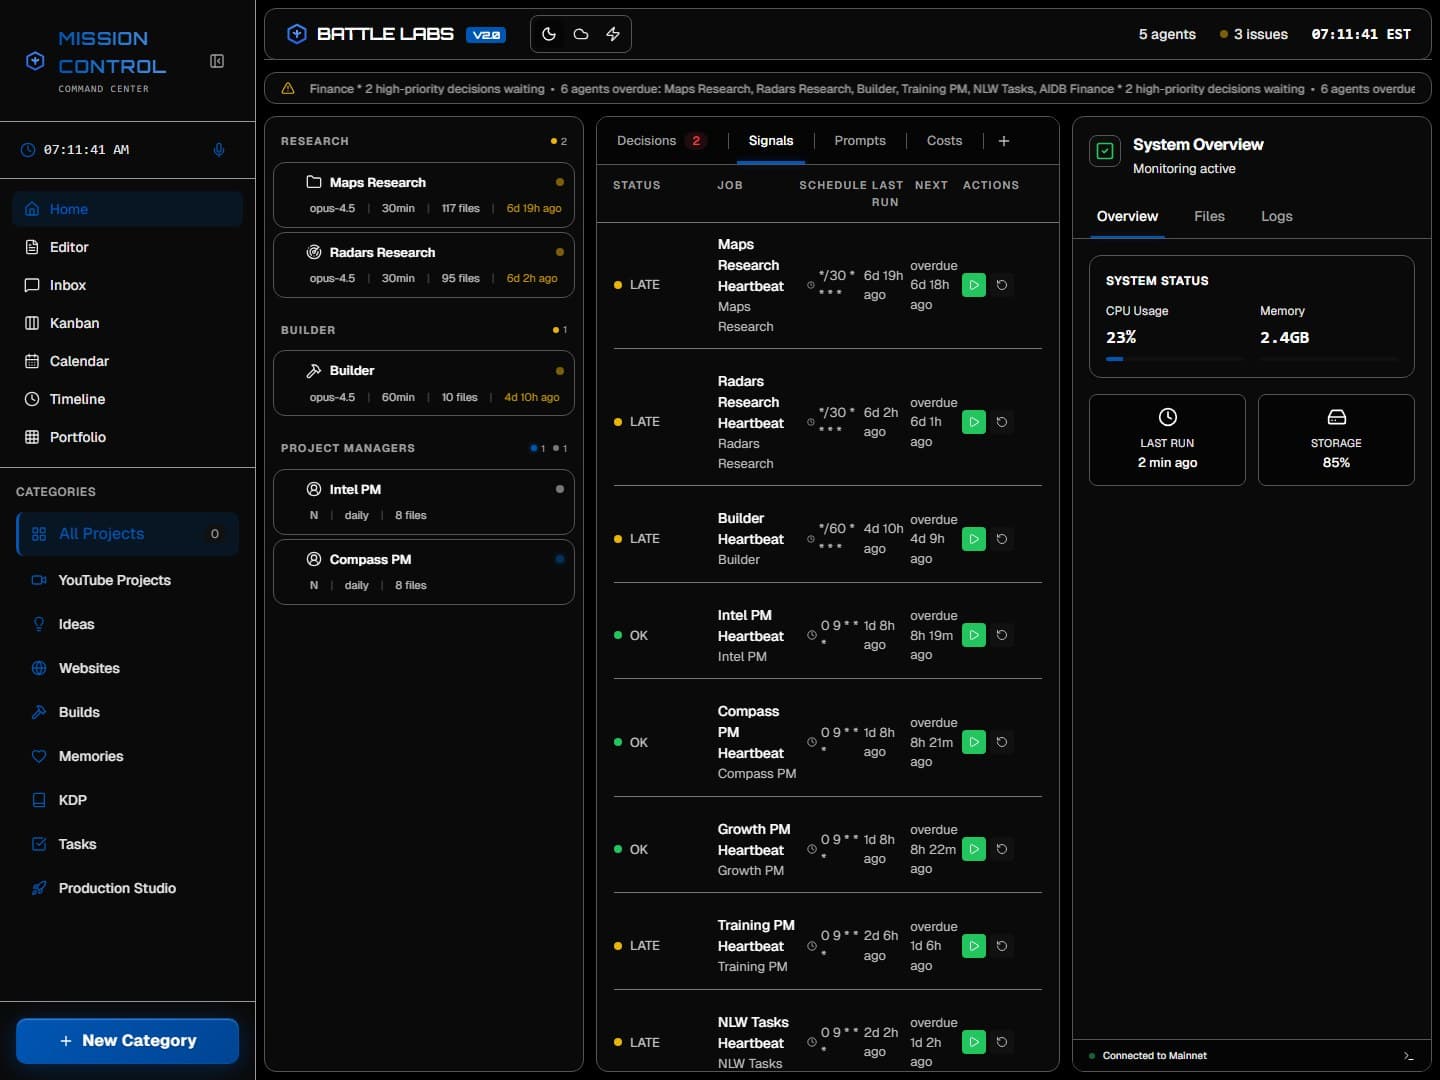
Dark analytics console: KPI tiles with sparklines, an activity feed and multi-series performance charts.
2 tools★ 80
#analytics#charts#kpi
Cursorv0
The prompt
Prompt
# Ops Dashboard — Dark Analytics Console

## What you're building

A dark operations console for `{{brand}}`: four KPI tiles with inline sparklines across the top, a multi-series performance chart, a secondary chart pair, a three-window sample-comparison block, and an activity feed that says what the system actually did. Audience: the operator who checks this twice a day and needs to spot a regression without reading a table.

The distinctive idea is that **every headline number is shown with its own recent history attached** — a tile is never just a figure, it is a figure, the shape of how it got there, and a stated comparison window. A dashboard that shows `61%` without saying *against what, over what* is a decoration.